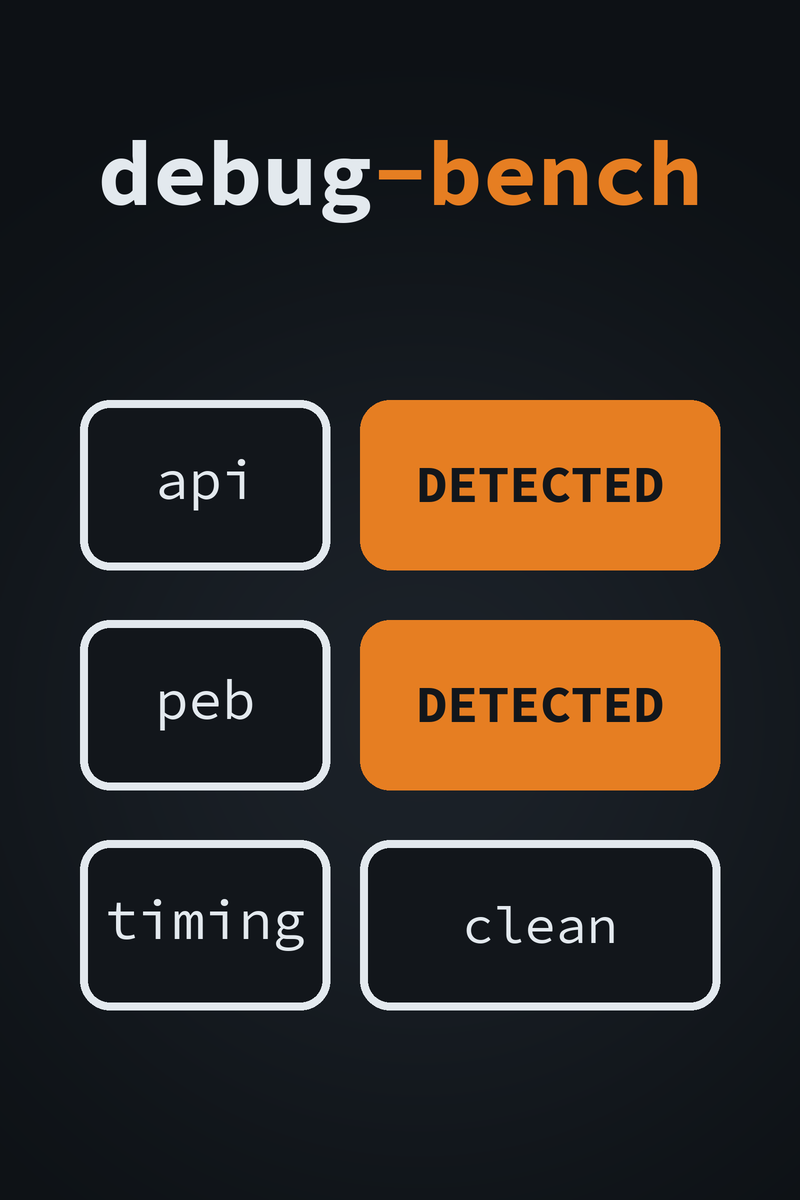
debug-bench cover: the api and peb checks marked DETECTED in orange, and timing clean

debug-bench logodebug-bench

Anti-debug self-test target for Windows
Price
Free
Version
1.0.0
Platform
Windows
License
MIT
Free & Open Source Anti-Debug Checks Test Target C++20 32 & 64-bit
debug-bench is a program that runs thirty well-documented anti-debug checks against its own process. It prints which ones fire and the raw value each one read. Each check also carries a plain explanation of what it detects, when it gives a false positive, and how it is commonly neutralized. Attach a debugger and some of the checks start to fire. Turn on a debugger-hiding plugin, or your own, and watch which ones go quiet. It is a self-test, not a bypass. It does not touch any other process and it changes nothing on the system. It is a companion to The Game Hacker’s Handbook, whose anti-debugging chapters list these techniques. Use it to check that a debugger stays hidden, including the one built into Pointer Lab.
Free
One zip with the 64-bit and 32-bit executables. Extract it anywhere
↓ Download from GitHub View Source on GitHub
Developer
Game Reversal Club
Open Source Software

See all software from this developer

What You Get

Run debug-bench.exe with no arguments and this table is printed. This is real output, from a 64-bit Release build run with no debugger attached.

api
  clean     api.isdebuggerpresent          IsDebuggerPresent() = FALSE
  clean     api.remotedebugger             CheckRemoteDebuggerPresent() = FALSE
  clean     api.debugport                  ProcessDebugPort = 0x0
  clean     api.debugflags                 ProcessDebugFlags = 0x1
  clean     api.debugobject                ProcessDebugObjectHandle = 0x0

peb
  clean     peb.beingdebugged              PEB.BeingDebugged = 0
  clean     peb.ntglobalflag               NtGlobalFlag = 0x00000000
  clean     peb.heapflags                  Heap Flags = 0x00000002
  clean     peb.heapforceflags             Heap ForceFlags = 0x00000000

exception
  clean     exception.int3                 our __except caught the breakpoint
  clean     exception.int3long             our __except caught the long breakpoint
  clean     exception.singlestep           our __except caught the single-step
  clean     exception.guardpage            our __except caught the guard-page fault
  clean     exception.closehandle          CloseHandle(bad) returned quietly
  clean     exception.outputdebugstring    last error preserved

timing
  clean     timing.rdtsc                   RDTSC delta = 230 cycles
  clean     timing.rdtsccpuid              RDTSC-around-CPUID delta = 1052 cycles
  clean     timing.rdtscp                  RDTSCP delta = 122 cycles
  clean     timing.qpc                     QPC delta = 1 ticks
  clean     timing.gettickcount            GetTickCount64 delta = 0 ms

context
  clean     context.hardwarebreakpoints    Dr0=0x0 Dr1=0x0 Dr2=0x0 Dr3=0x0 Dr7=0x0
  clean     context.threadhide             ThreadHideFromDebugger = clear

environment
  clean     environment.parentprocess      parent = bash.exe
  clean     environment.debuggerwindows    no debugger windows
  clean     environment.debuggerprocesses  no debugger processes
  clean     environment.debuggerdevices    no debugger devices
  clean     environment.moduleallowlist    all 12 modules under allowed paths
  DETECTED  environment.hypervisorbit      CPUID.1:ECX[31] = 1
  DETECTED  environment.hypervisorvendor   hypervisor vendor = Microsoft Hv
  clean     environment.kerneldebugger     KdDebuggerEnabled=0 KdDebuggerNotPresent=1

2 of 30 checks fired.

The two environment checks fire on a physical PC because Windows runs its virtualization-based security on Hyper-V, which sets the hypervisor bit. That is not a debugger. It is the false positive their explanations describe.

Under x64dbg

These are real results with plain x64dbg 2026.05.27, no hiding plugin, on Windows 10 19045. The test used x64dbg’s headless.exe, so it could be scripted and the output captured. “Yes” means the check fired.

CheckAttached while runningAttached before the first instructionAfter detach
api.isdebuggerpresentYesYesNo
api.remotedebuggerYesYesNo
api.debugportYesYesNo
api.debugflagsYesYesYes
api.debugobjectYesYesNo
peb.beingdebuggedYesYesNo
peb.ntglobalflagNoYesNo
peb.heapflagsNoYesNo
peb.heapforceflagsNoYesNo
exception.closehandleYesYesNo

The heap and global-flag checks fire only when the debugger is there as the process starts. Windows sets those flags while it loads the process. api.debugflags stays set after the debugger detaches, so it also shows a debugger that has come and gone.

The int3, single-step and OutputDebugString checks did not fire. x64dbg stopped on each exception, and when it resumed, the program’s own handler still ran. The debugger-window check did not fire because the headless build has no window. The x64dbg GUI would trip it. The two hypervisor checks fired in every run, as above.

How It Works

Six classes of check
API, PEB, exception, timing, context and environment. Each check is one function that returns its id, name, class, whether it fired and a detail line. --only <class> runs one class at a time.
The value and the reason
The detail line shows the raw value each check read, such as ProcessDebugFlags = 0x1. Each check also carries an explanation of what it detects, its false positives, and how it is commonly neutralized. The explanations are in the --json output and in src/core/Checks.cpp.
Watch checks flip live
--loop [ms] re-runs the checks on an interval. Attach a debugger while it runs and watch which checks start to fire. Turn on a debugger-hiding plugin and watch them go clean again.
Honest about soft checks
The timing class fires on stepping or a slow virtual clock, not on a debugger that is only attached. The environment class flags a VM and injected modules that may have nothing to do with a debugger. Each such check says so.
A self-test, not a bypass
debug-bench only reads its own process. It does not attach to, read or modify any other program, and it writes nothing to the registry or disk. The techniques are the published catalog from the anti-debugging literature.
Tested without a debugger
Every reading from the operating system sits behind an interface. The logic that decides whether a reading means a debugger is unit-tested against fabricated clean and debugger-present readings. No debugger, Administrator or target process is needed.

Item Specifics

Name
debug-bench
Author
Heath Howren (“Cyborg Elf”)
Version
1.0.0 (2026)
Type
Command-line test target: anti-debug self-test
Platform
Windows; 64-bit and 32-bit executables
License
MIT License
Price
Free
Language
C++20, with a small MASM stub for the exception checks
Dependencies
None in the binary: only the Windows system libraries and the static C runtime
Distribution
debug-bench-v1.0.0.zip, with release\x64\debug-bench.exe and release\x32\debug-bench.exe
Requirements
Windows. No Administrator and no Visual C++ redistributable
Tests
32 unit tests, run in a 64-bit and a 32-bit test binary in CI
Source Code

Features

Thirty checks in six classes
IsDebuggerPresent and CheckRemoteDebuggerPresent
ProcessDebugPort, Flags and ObjectHandle
PEB BeingDebugged and NtGlobalFlag
Heap Flags and ForceFlags
int 3, single-step and guard-page traps
CloseHandle and OutputDebugString checks
RDTSC, RDTSCP, QPC and tick-count timing
Hardware breakpoint registers
ThreadHideFromDebugger
Parent process and debugger windows
Debugger processes and device objects
Loaded-module allowlist
Hypervisor bit and vendor
Kernel debugger check
Raw value shown for every check
False positives explained per check
JSON output for scripts
--loop to watch checks flip
--only to run one class
Reads only its own process
64-bit and 32-bit builds

Before You Download

Intended use. debug-bench is for studying software you own or are authorized to analyze, and for testing your own debugger and anti-debug tooling. It is a target you run yourself. It only reads its own process and changes nothing on the system. Using a debugger against online or competitive games will very likely trip anti-cheat software and get the account banned. This is a research tool.

The binaries are unsigned. Antivirus software may flag a program that reads its own PEB and raises breakpoints. Build it from source if you would rather not take a binary on trust.

No Administrator needed. Nothing in debug-bench needs Administrator. Running it as a normal user is the intended case.

Some checks fire with no debugger. The hypervisor checks fire in a VM, and on a PC running virtualization-based security, WSL 2 or Docker. The timing checks fire on stepping or a slow virtual clock. Each check’s explanation says when it gives a false positive.